- April 29, 2026 12:00 pm
- by Manek
- April 29, 2026 12:00 pm
- by Manek
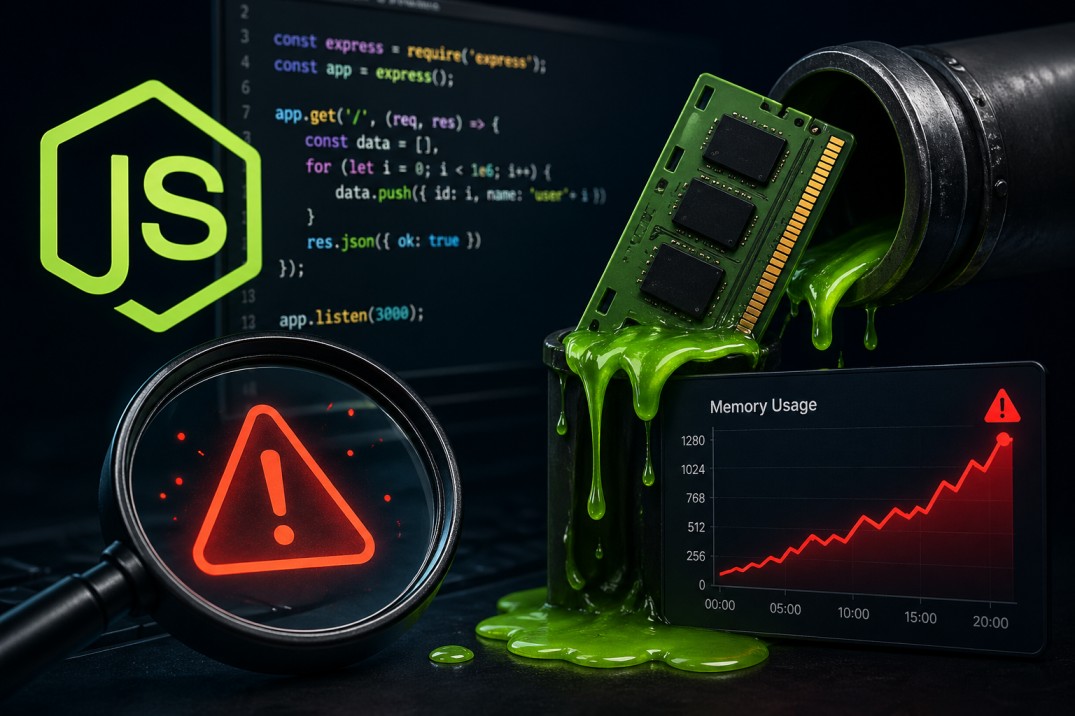
Ever watched a Node.js app get slower? More RAM used each hour, then sudden failure with no clear cause. That quiet drain often points to one thing: memory slipping away where it should not. Fixing these leaks tests patience because nothing seems wrong at first glance. Day one runs smooth. By day three, hiccups appear. Come Friday, servers fall silent. Teams managing live systems know this pattern well. Trouble like that risks outages, vanished info, and heavier costs. Picture tracing where hidden glitches grow inside software, spotting those hiccups with smart tools, then clearing them out long before crashes hit. When safety worries stretch past app performance, consider what Vofox offers in protecting digital spaces.
Memory fills up in Node.js when stored data sticks around without being cleared out. Though V8 powers Node and brings automatic cleanup, it cannot touch what still has links pointing to it. Unused bits should vanish, yet they remain if any part of the script keeps them close. References left behind block release, like doors held open by unseen hands. Objects linger not because of broken tools, but quiet persistence in code paths. Even small oversights pile into weight over time. Trapped memory answers only to forgotten connections. Nothing crashes right away; pressure builds below sight.
When Node.js servers keep running, things get tricky. A regular script starts, does its job, then ends, but these servers stay alive for days or even weeks straight. Imagine losing just a tiny bit of memory every time someone makes a request. At first it seems harmless. Over time though, those little losses pile up, slowly turning into something massive. What begins as a few kilobytes sneaks toward gigabytes before you notice. Spotting where that loss happens becomes essential work. Backend engineers who handle Node.js need to know how to track down these hidden drains fast.
Stuff saved on global variables sticks around. The moment you add information there, either straight into a variable or onto the whole environment, it stays alive as long as the program runs. Tossing more items into a global array or object with nothing removing old pieces means the system uses more and more space. That pile never shrinks unless someone steps in. A single forgotten cleanup can pile up over time. Think about how often code hooks into events using .on(), then just leaves them hanging. Each attachment sticks around unless someone explicitly clears it with .off(). Stale connections quietly build up behind the scenes, holding onto chunks of memory that should have been released. That kind of oversight shows up everywhere, especially in long-running services where listeners multiply unchecked.
Holding onto values without meaning to happens with closures. These bits of code carry along outside data, sometimes way past their usefulness. Picture one tucked in a repeating loop, stuck on some forgotten task. It clings to things long after they should have vanished. What looks gone might still be hanging around, trapped by a small piece of logic running again and again. Loops ticking endlessly can lock up memory. Start an interval without clearing it later? That function sticks around along with every value inside it. Same thing happens if a timeout holds on to bulky data. Forget cleanup, keep the baggage.
Not every cache plans for cleanup. Some developers lean on basic JavaScript objects or Maps to store data quickly. When there is no cap on size or expiration set, the stored entries pile up. A fix meant to speed things up slowly eats available memory. Leaky streams happen in Node.js when reading or writing ends without closing properly. When something goes wrong during transfer, the cleanup step might get skipped. An error can reroute execution, leaving buffers hanging open by accident. Without proper handling, those connections refuse to let go. Code written by others can leave traces behind even when done running. A package pulled from npm could attach itself to system-wide signals, keeping things alive longer than expected. Memory problems do not always start where you think they do. Try removing outside tools one at a time, watching closely what happens after each step.
Start by keeping an eye on memory usage over time. Use built-in tools to take snapshots of the heap, then compare them one after another. Between each check, trigger similar workloads so results stay consistent. If objects stick around longer than they should, that hints at leaks. Check heap size with Node's own process.memoryUsage(). This gives numbers such as heapUsed and heapTotal. When heapUsed keeps rising and never levels off, something is likely holding memory it should release. setInterval(() => { const mem = process.memoryUsage(); console.log(`Heap used: ${Math.round(mem.heapUsed / 1024 / 1024)} MB`); }, 5000); You won't find the exact spot of the leak here, yet it confirms something is getting out. Launch Node.js with the --inspect option so Chrome DevTools can attach. Go to the Memory section, snap the current heap, push some activity through your app, then grab a second snapshot. Line up both views to spot what kinds of objects piled up in between. node --inspect app.js Fire up Chrome and type chrome://inspect into the address bar, pick your target, and profiling begins. The clinic.js tool from NearForm is free and shared openly. Running clinic doctor on your app surfaces clues about memory habits without much setup, outputting a readable summary even when you have never poked at performance data before. npm install -g clinic clinic doctor -- node app.js The heapdump package grabs memory snapshots on command during runtime. These .heapsnapshot files open in Chrome DevTools for close inspection. Spotting leftover objects that should have vanished often shows exactly where the leak lives.
Fixing it tends to go smoothly after spotting the source, yet the real reason might hide in small details. Sometimes a quiet clue gives it away, still the answer isn’t always obvious. The spot where water shows up? Not always where it started. A tiny gap, maybe missed at first, often explains the mess later. You see the drip, then trace back - slowly - the path it took. When done with event listeners, take them out. Instead of keeping things around, call emitter.removeListener(). If just one trigger matters, go with .once(). Classes should have a way to clear up after themselves. A destroy() function helps remove every listener added while active. Clean ends make future bugs less likely. Large amounts of data should stay out of closures when they do not need to be there. When a closure pulls in variables from outside, check each one - do you really use it inside? Not every captured value earns its place. If some just sit unused, shift the structure so only what is necessary remains visible. Trim the reach of the function where possible. Unneeded bindings cost memory. A tighter scope often means fewer surprises later on. Start by putting eviction into your caches. Instead of plain objects, pick something such as lru-cache - a tool built for holding limited data. Once space runs low, older items vanish on their own, simply because freshness wins every time. Timers should never stay active by default. Hold on to what setInterval() and setTimeout() give back so you can stop them later. When something shuts down or gets removed, that is when you clean up using clearInterval() or clearTimeout(). When something goes wrong, catch it early. A missing error listener might let problems slip through. Close things properly once done. Think of cleanup before moving on. Leaving a stream open ties up space. End each one by hand when work finishes. Forgetting this step holds onto memory longer than needed.
Run load checks inside your CI/CD flow and watch how heap usage shifts during each run. When things work right, memory levels settle instead of rising nonstop. Tools like Datadog, New Relic, or Prometheus with Grafana plot live memory data and trigger alerts when heap crosses a set threshold. Code reviews that look for unbounded caches, dangling event listeners, and closures holding on too tight catch problems before they reach production. eslint-plugin-node snags typical missteps without much noise. Understanding how V8 splits memory into new space and old space helps too. Fresh objects vanish quickly when no longer needed, cleaned up in the younger section. Trouble shows when temporary data gets dragged into older memory by hidden references that avoid cleanup. Spotting these behaviors reveals why certain code choices slowly inflate heap usage over time. One thing people skip sometimes is setting up handlers for process.on('exit') and process.on('SIGTERM'). When shutdowns happen cleanly, closing databases, stopping streams, canceling timers, and detaching listeners, it prevents leftover chaos in memory. Acting tidy on exit shows the system was built with care.
Figuring out memory leaks in Node.js apps means staying calm with useful tools nearby. Heap checks show if there really is a problem and give clear signs something is off. Snapshots from DevTools or clinic.js help narrow things down toward trouble spots. Leaks often hide in event listeners that never let go, caches growing without limits, or closures holding references longer than needed. A small fix, sometimes just rewriting part of one function, can make the issue disappear entirely. Watching memory closely from the start prevents bigger headaches later. Stability and smooth performance over time come from paying attention early. Get in touch with Vofox’s app developers for leak-free node.js development.
Guaranteed Response within One Business Day!

5 Benefits of Choosing an Indian PHP Web Development Company for Global Businesses

Why Hire a Software Development Company in India in 2026?

Hire React Native Developers: Everything You Need to Know Before Starting a Project

Key Services Offered by a React Native App Development Company

React Native Development Services and Their Role in App Development

Guaranteed Response within One Business Day!